easyjob Business Information Center
Documentation
Business Information Center
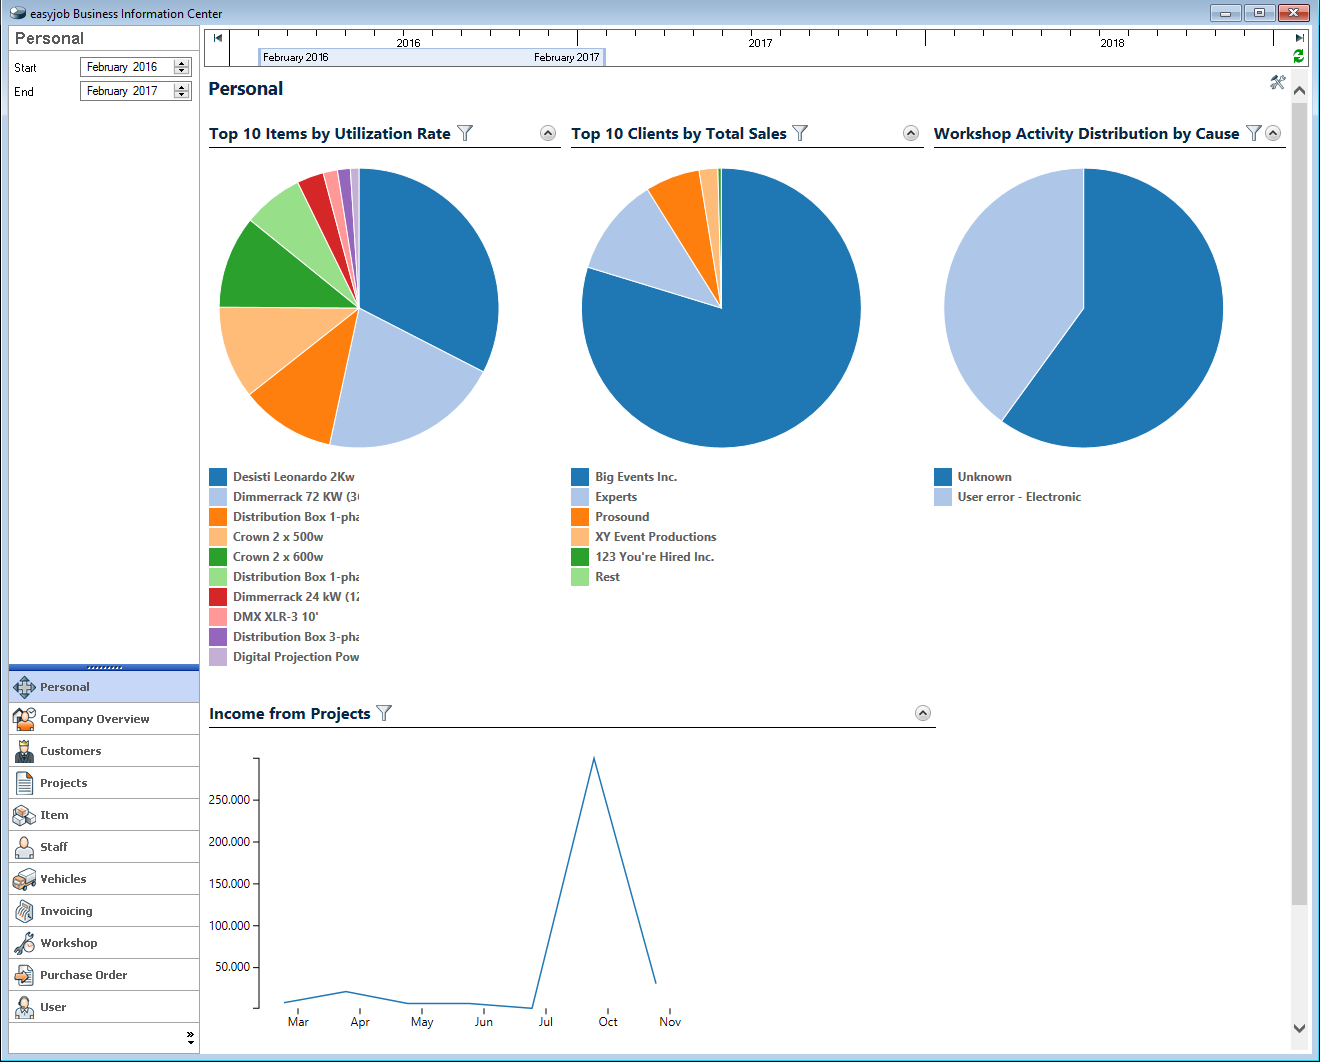
The new easyjob Business Information Center offers you the opportunity to view and evaluate all company data that is relevant for you. Many reports provide information in tables or chart format to the degree of detail you desire and help you optimally control your company. With the newly developed self-service tool, you can also put together all possible reports individually in addition to the large number of statistics that are already available.
We are happy to provide you with support. Contact us.
http://www.protonic-software.com/en/service/support/
Because the rental industry is so complex, we have developed different data interpretation formulas that can be customized to fit the way you do business. These formulas were developed in cooperation with industry professionals and a select group of easyjob users.
The calculation of the individual reports and charts can take some time. We have therefore decided not to calculate the data in advance, but to access the current data each time.
Installation and activation
The easyjob Business Information Center functionality is contained in the program components and is activated with the easyjob license. If you have the current easyjob update installed no additional installation is required.
Configuration and settings
No content for this section.
User settings
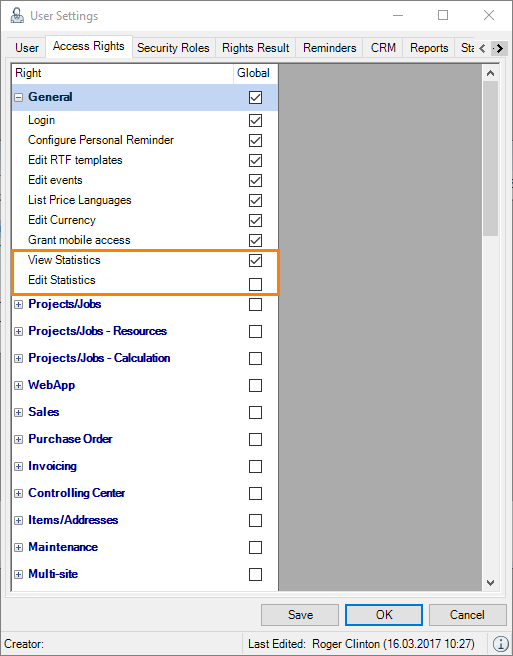
User rights for viewing statistics or to edit them are defined in the user settings.
Assigning user rights for statistics:
1. easyjob Menu Tools Manage Users
2. Select a User
3. Edit
4. Access Rights tab
5. General
6. Assign the desired rights
7. Save
8. Ok
Refer to chapter Restricted Access for information about how to restrict individual statistics for user access.
Basis of computation
The easyjob Business Information Center displays Sales by month.
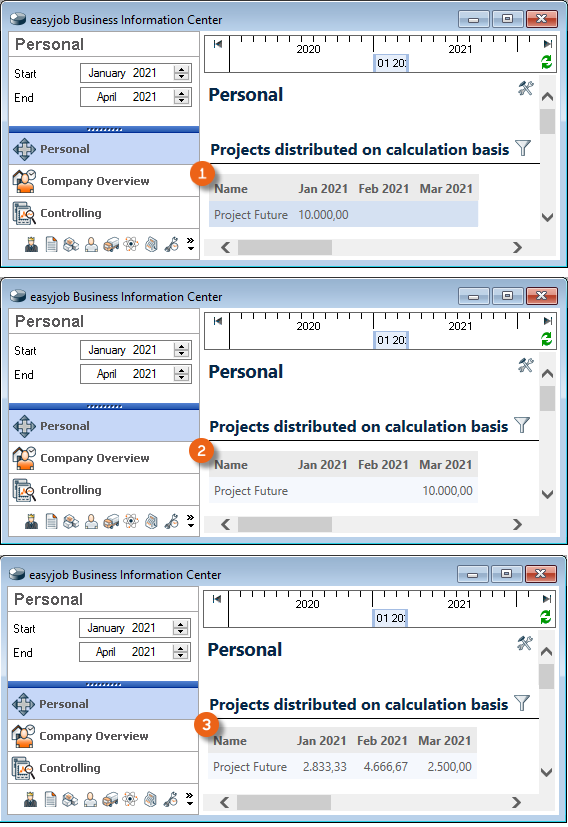
To establish the formula for specifying how projects spanning several months are calculated, select your preferred basis of computation in the easyjob settings. You can specify if the calculation should be based on the Project Start Date , the Project End Date or the variant Distributed over the project period .
Here is an example calculation for a project with $10,000.00 sales over a three month period from January 15 to March 15 2021.
| January (17 days) | February (28 days) | March (15 days) | |
|---|---|---|---|
| Project start date | $10,000.00 | ||
| Project end date | $10,000.00 | ||
| Distributed over the project period | $2,833.33 | $4,666.67 | $2,500.00 |
Defining the basis of computation:
1. easyjob Menu Tools Settings
2. Projects tab
3. Select the basis of computation
4. Ok
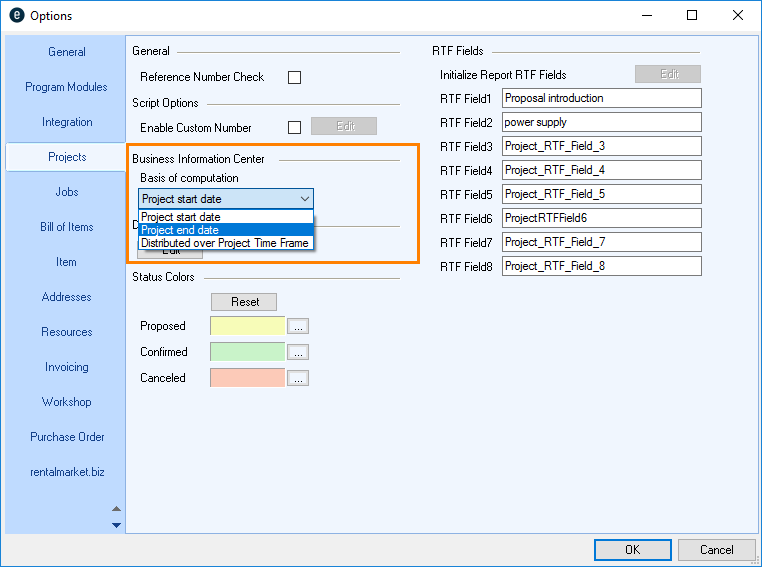
easyjob must be restarted to activate the changes.
Excluding from statistics
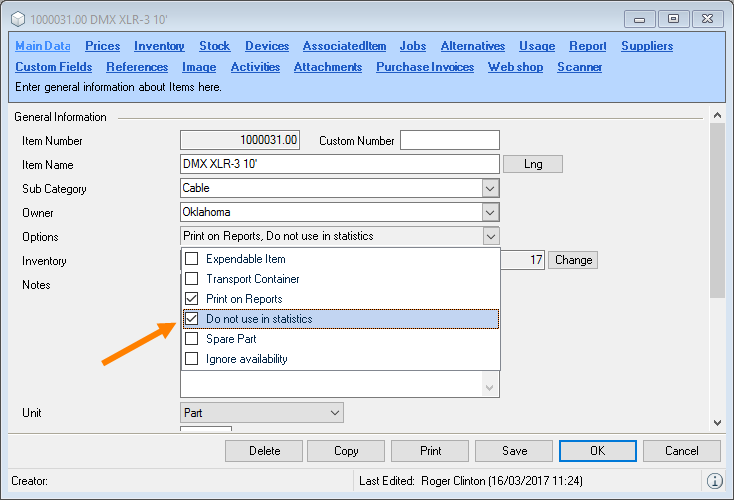
It is possible to exclude individual items from the statistics.
Excluding an item from the statistics:
1. Easyjob Menu Master Data Items
2. Edit
3. Main Data tab
4. Options
5. Check Do not use in statistics
6. Save
Statistics settings
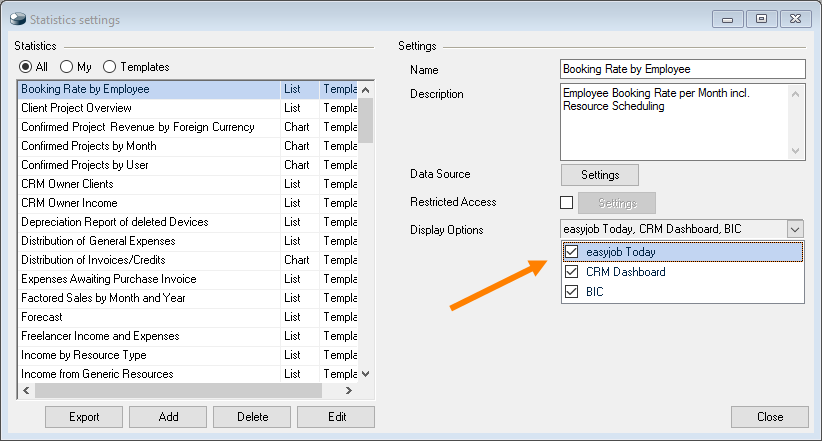
There are numerous statistics in the easyjob Business Information Center that were already created as a template. You can manage them in the Statistics settings. With the Filter you can limit which Statistics should be displayed. After selecting a Statistic you can carry out additional Settings . In addition to editing the Name , Description and Data Source it is possible to restrict access to certain Statistics . Furthermore, you can define where this Statistic (e.g. easyjob Today or CRM) should be made available .
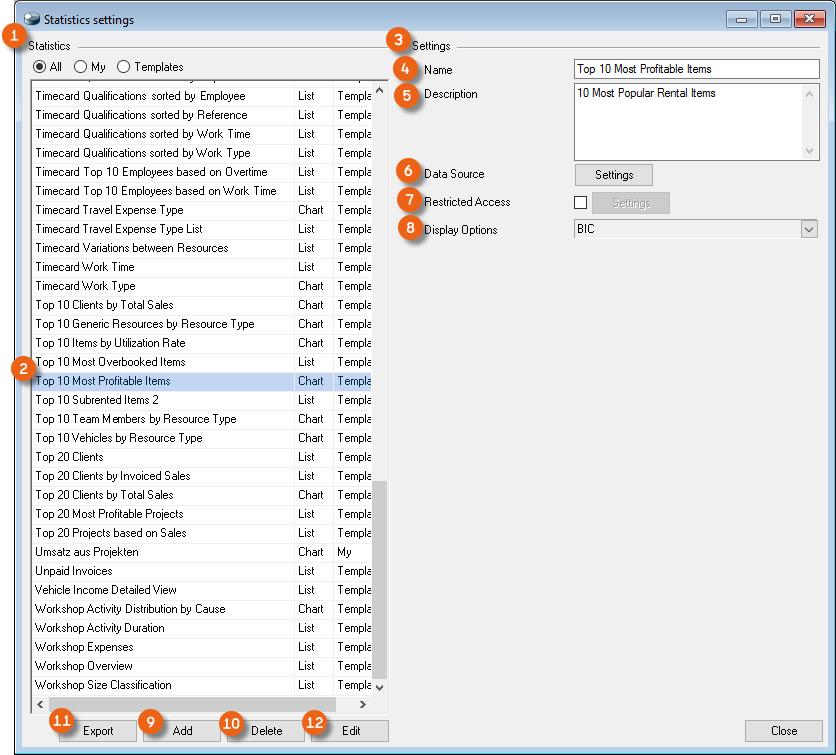
You can Add , Delete , Export or customize the Design and therefore also the Basis of Computation for Statistics.
Defining Statistics Settings:
1. easyjob Menu Statistics Settings
2. Select a Statistic
3. Modify the desired Settings
4. Close
Data Source
You can use the Data Source to determine the basis on which a Statistic is created. More information can be found in chapter Creating your own Statistics.
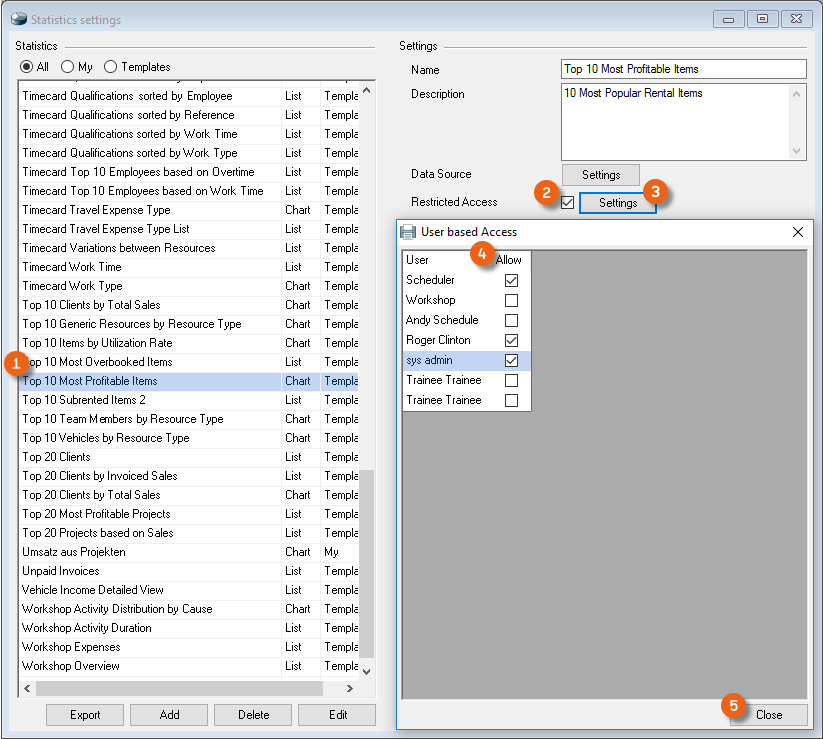
Restricted Access
You can provide Restricted Access for individual Statistics, for example for sales and staff Statistics that should not be accessible for everyone.
Providing restricted access:
1. easyjob Menu Statistics Settings
2. Select a Statistic
3. Check the Restricted Access box
4. Click Settings
5. Check the box for the Users who should receive access
6. Close
In User Settings, the Statistics tab displays the possibility to allow statistics to be viewed by checking the relevant box . If the User does not have access permission, these Statistics are hidden in the User Settings .
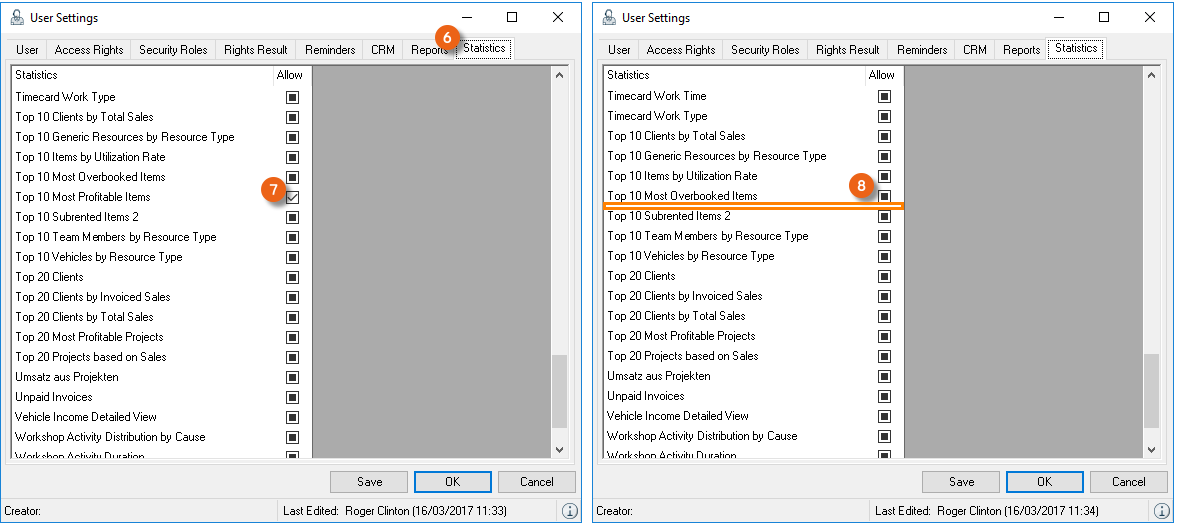
Viewing Statistic rights in User Settings
1. easyjob Menu Tools Manage Users
2. Select a User
3. Edit
4. Select the Statistics tab
Display Options
It is possible to display selected Statistics not only in the Business Information Center, but also in easyjob Today or on the CRM Dashboard.
Expanding display options:
1. easyjob Menu Statistics Settings
2. Select a Statistic
3. Under Display options, select the drop-down menu
4. Select the desired view area
5. Close
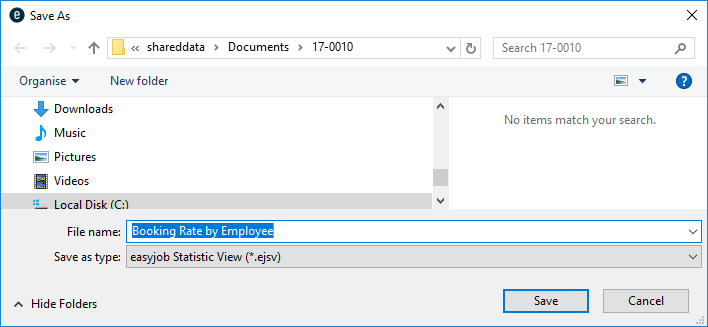
Export
With Export, you are able to save a Statistics Template in your computer.
Design
In Design mode, you can customize a Statistic to meet your individual needs. More information can be found in chapter Editing existing Statistics.
General
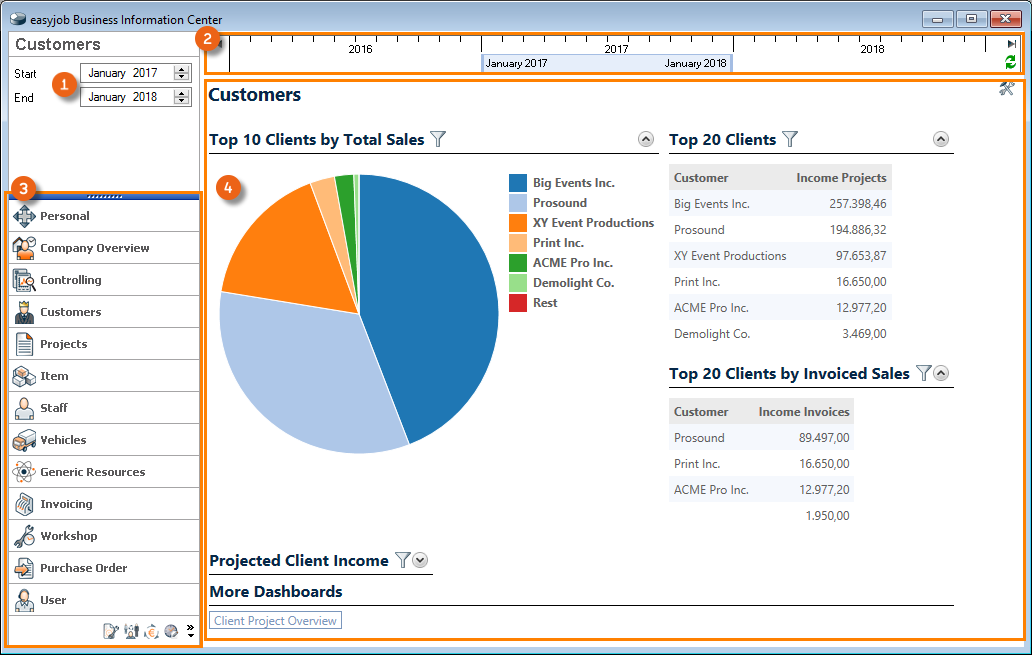
The easyjob Business Information Center is essentially divided into three areas. In addition to the display of the time frame as month/year or on the time bar in which the key figures should be determined, there are preset categories and a Statistics area with the so-called Dashboard for data output in tabular form or as a graph.
Opening the Easyjob Business and Information Center:
1. easyjob Menu Statistics Business Information Center
Time Frame
With the Time Frame, you can define the start and end time of your reports. The report always starts on the first day of the indicated month and ends on the last day of a month. You can use the arrow keys to directly enter the month and year for the time frame. With the left mouse button you can push the time bar to the desired position or use the items available in the drop-down menu . Press the Refresh button to update your selected Statistics for the set time frame. Many reports compare the selected time frame data with data from the same time frame in the previous year. Therefore a maximum time frame of one year can be selected.
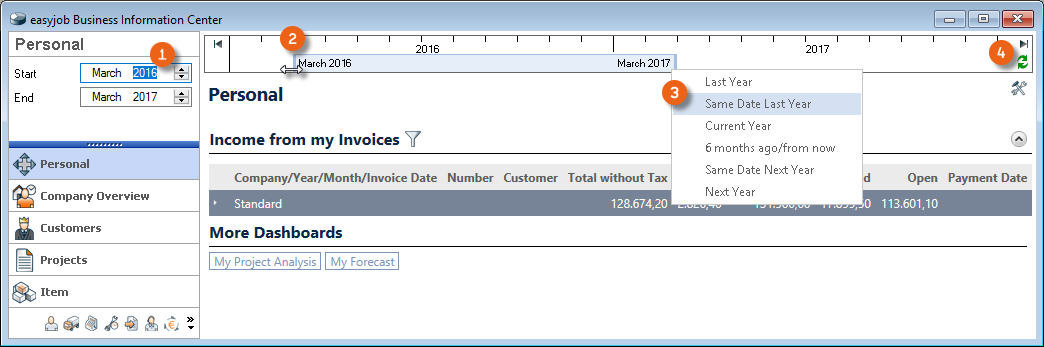
You selected the time frame 'Same Date Last Year', your report starts on the first day of the current month one year ago (e.g. March 1, 2016) and ends on the last day of the last month (February 28, 2017) of the year time frame. From March 2016 until March 2017 means March 1, 2016 until February 28, 2017.
Categories
In the Personal category, all users can set up their own area and select the settings and statistics that are relevant for them.
These settings are stored in the personal user profile for each user and are available everywhere the user logs into easyjob. If changes are made in other categories, they apply globally for all users.
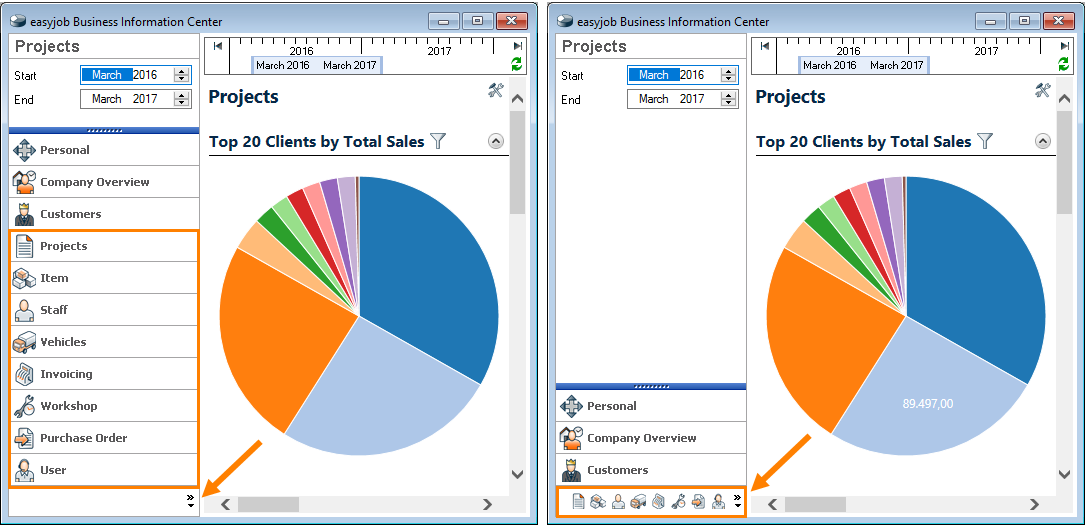
We have already prepared various Statistics for you in the categories. In order to show more or fewer categories in your View, click the arrow keys as shown in the image.
Dashboards
Many Settings are possible on the Dashboards. You can define which Statistics templates are displayed to meet your needs. This also applies to filter settings.
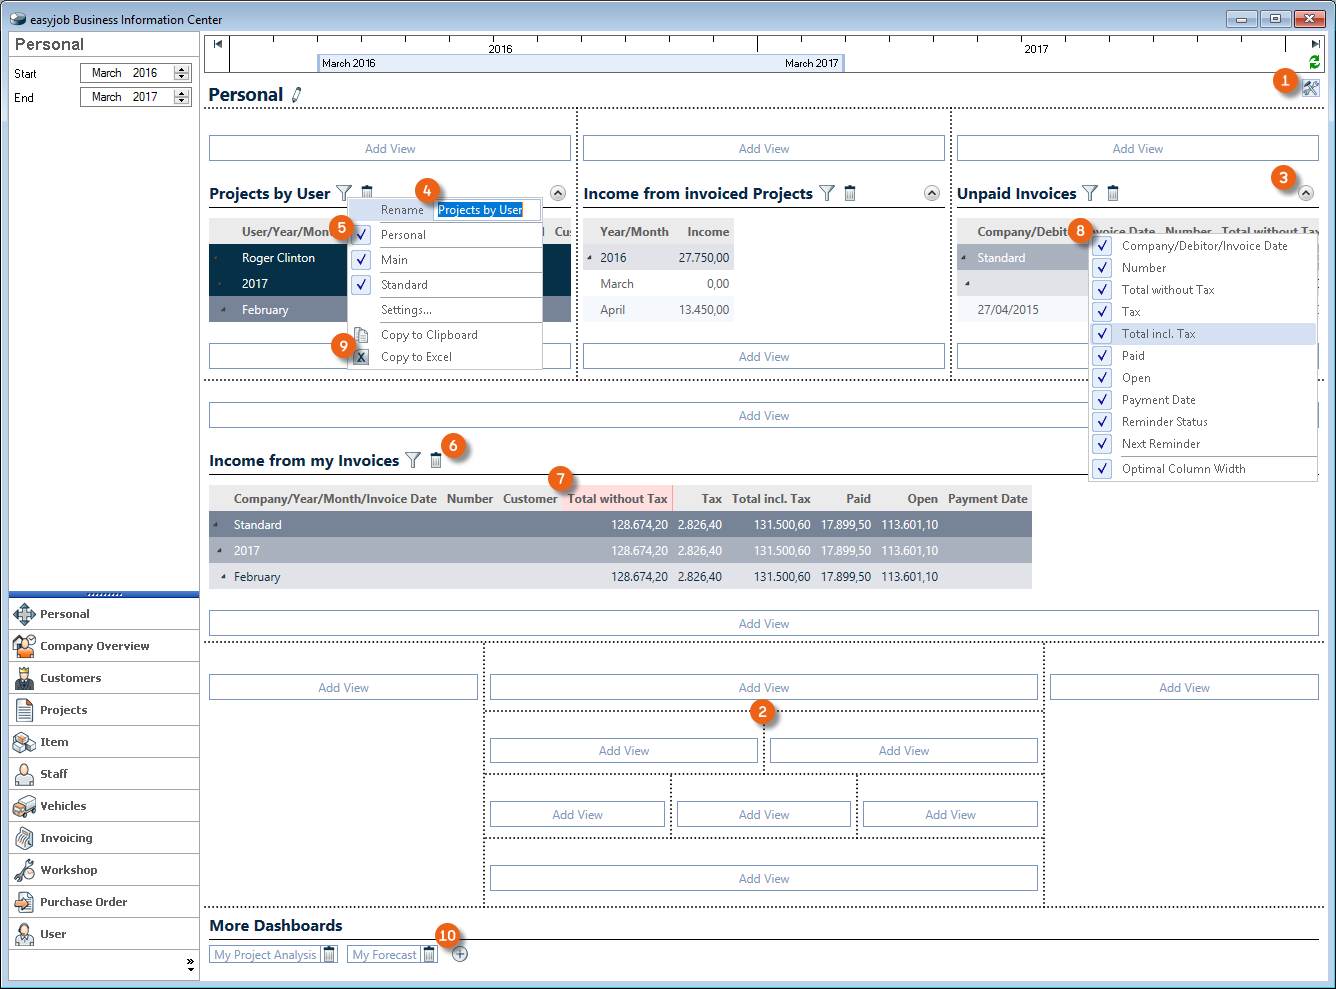
After switching to Settings mode you can freely order your information screen within the Matrix . It is possible to Open and Close as well as Rename , Filter and Delete views. You can move the Columns as required and display or hide them. The data for all Statistics can be copied to the Clipboard or to Excel for further use . If required, more Dashboards can be created . All the Statistics displayed in your personal area are calculated in real time when opening the easyjob Information Center or when performing a Refresh. For performance reasons, it may be useful to create some Statistics under More Dashboards . With Settings the variables of the Statistics can be customized. More information can be found in chapter Editing existing Statistics.
Inserting, ordering and filtering Dashboards as needed:
1. easyjob Menu Statistics Business Information Center
2. Switch to the Setting mode
3. Select the desired position within the matrix and add a view from the selection list.
4. Ok
5. Modify the settings (rename, filter, columns, etc.)
6. Leave the Settings mode
Editing existing Statistics
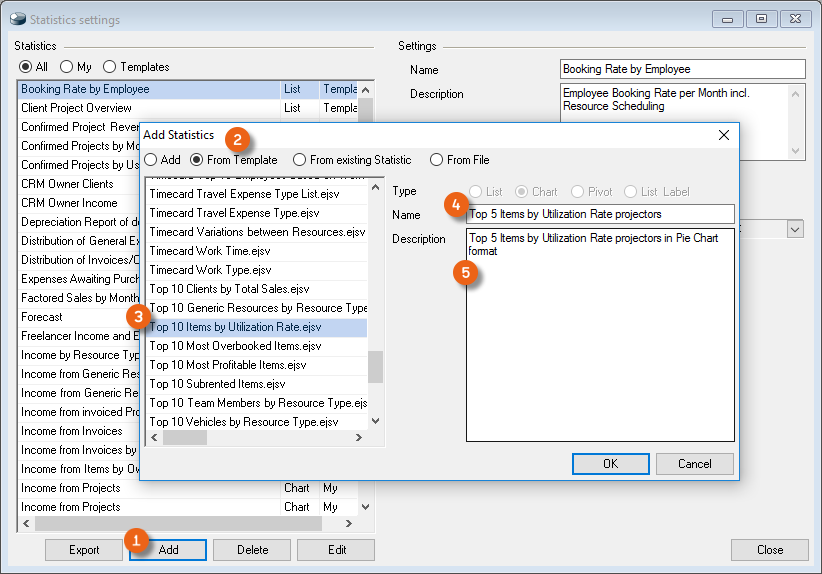
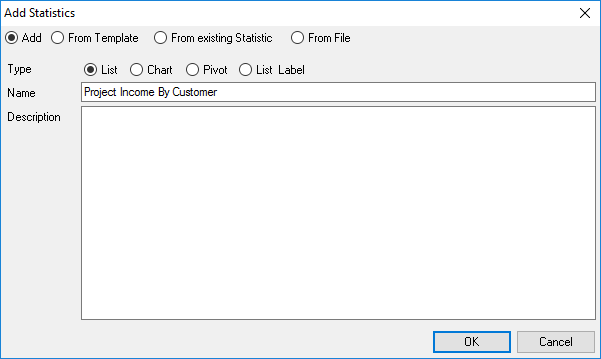
To be able to edit existing Statistics, you must first copy and rename them. The original remains unchanged as a Template. By clicking Add and selecting From Template you can select the desired Statistic . Enter a new Name , and if necessary a Description and save your new Statistic .
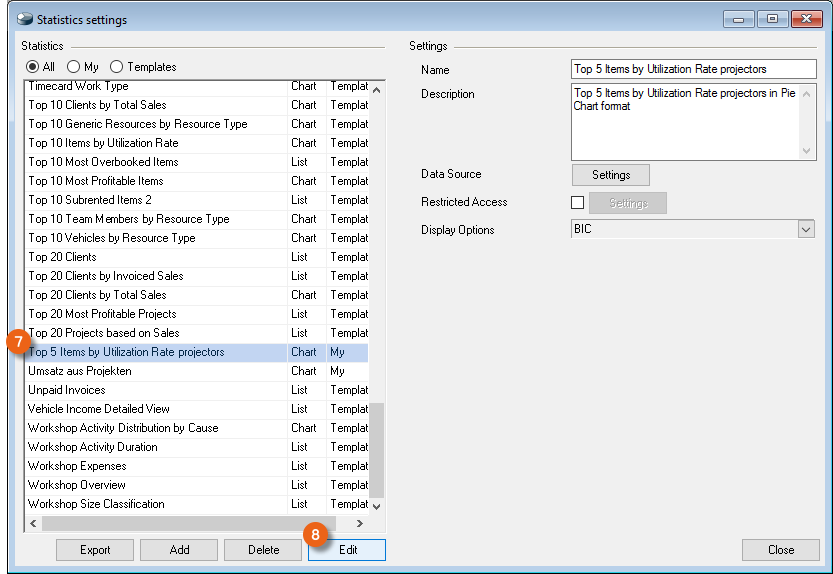
You can open your newly created Statistic to customize it with a double click or click Design .
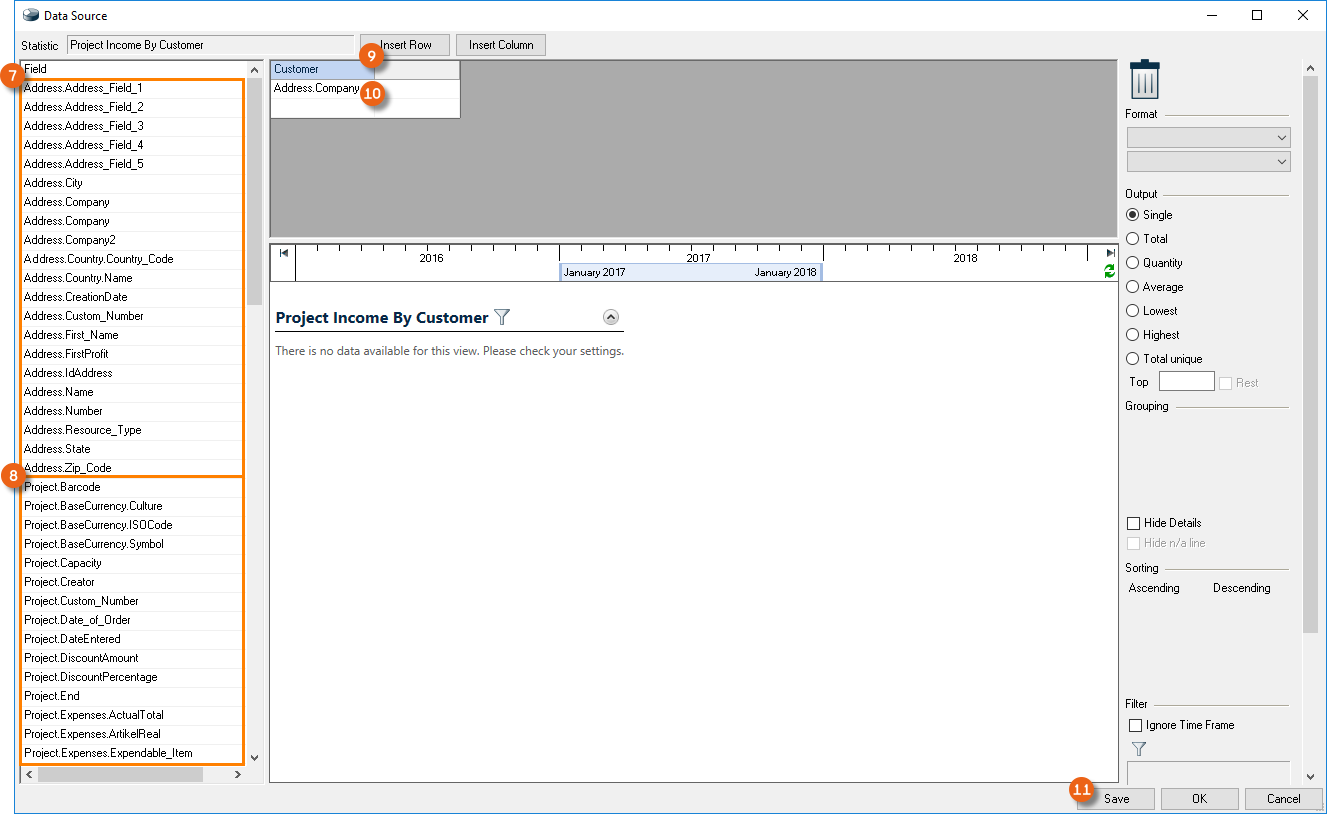
The header displays the name of the Statistic you are currently editing. All the Variables you can use to create the current Statistic are displayed under Field . The current Formula and a Preview are displayed in the central section. Depending on the Statistic, you can edit the Diagram type , Format , Output , Grouping and Sorting . The number of Top Statistics can be customized here . Individual Filters make a more detailed selection possible. This Filter setting always refers to total Statistics.
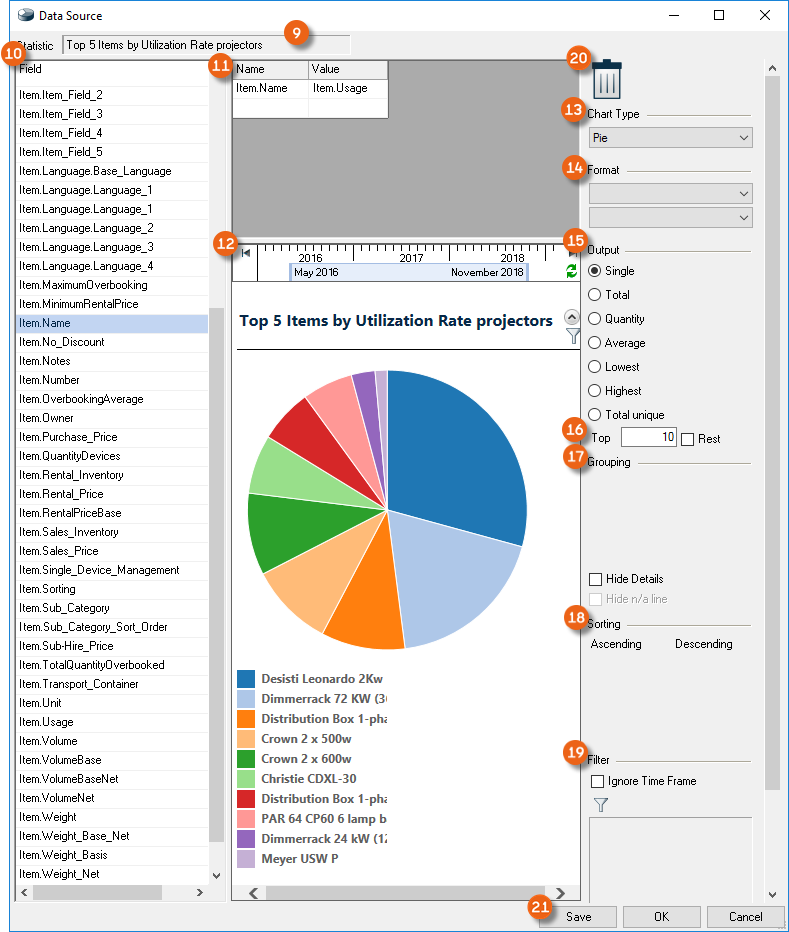
You can delete set Formulas, Groupings or Sortings by dragging and dropping them to the recycle bin icon . Click Save to update the Preview mode so you can check the Settings you made.
Creating Statistics from a template:
1. easyjob Menu Statistics Settings
2. Add
3. From Template
4. Enter a name and a description, if necessary.
5. Ok
6. Double click the newly created Statistic
7. Edit the Settings
8. Save
9. Compare the result with the Preview, correct if necessary
10. Save
11. Ok
Sample statistic, Top 5 Items by Utilization Rate projectors
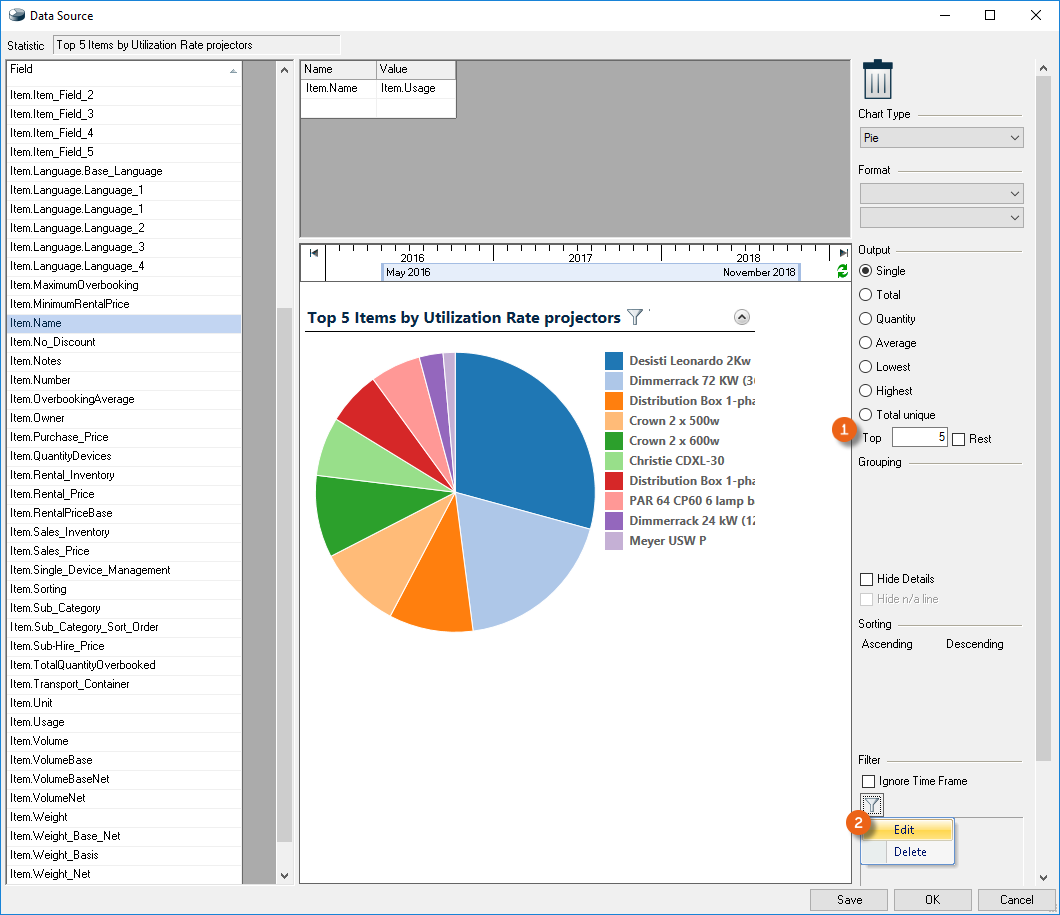
The Statistic indicated above should be created. The existing Statistic Top 10 Items by Utilization Rate can be used as a Template. Create a new Statistic with the title Top 5 Items by Utilization Rate projectors as described above. Change the Top number accordingly . Click the filter symbol and select Edit .
With Value1 of the filter, you determine the Sub Category , the Operator and Value2 (here: Projectors) accordingly. Activate the filter with Add and Ok .
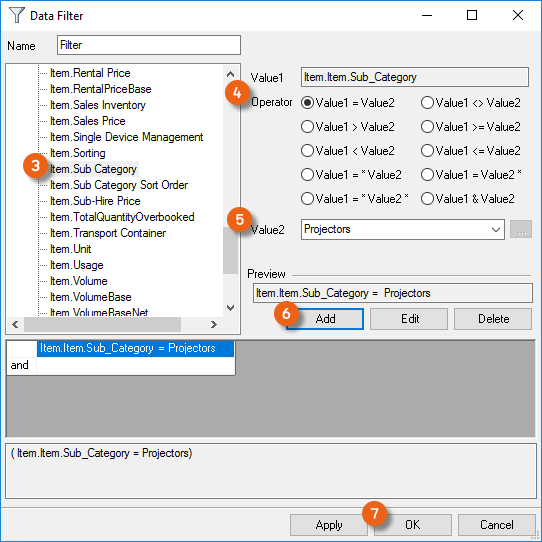
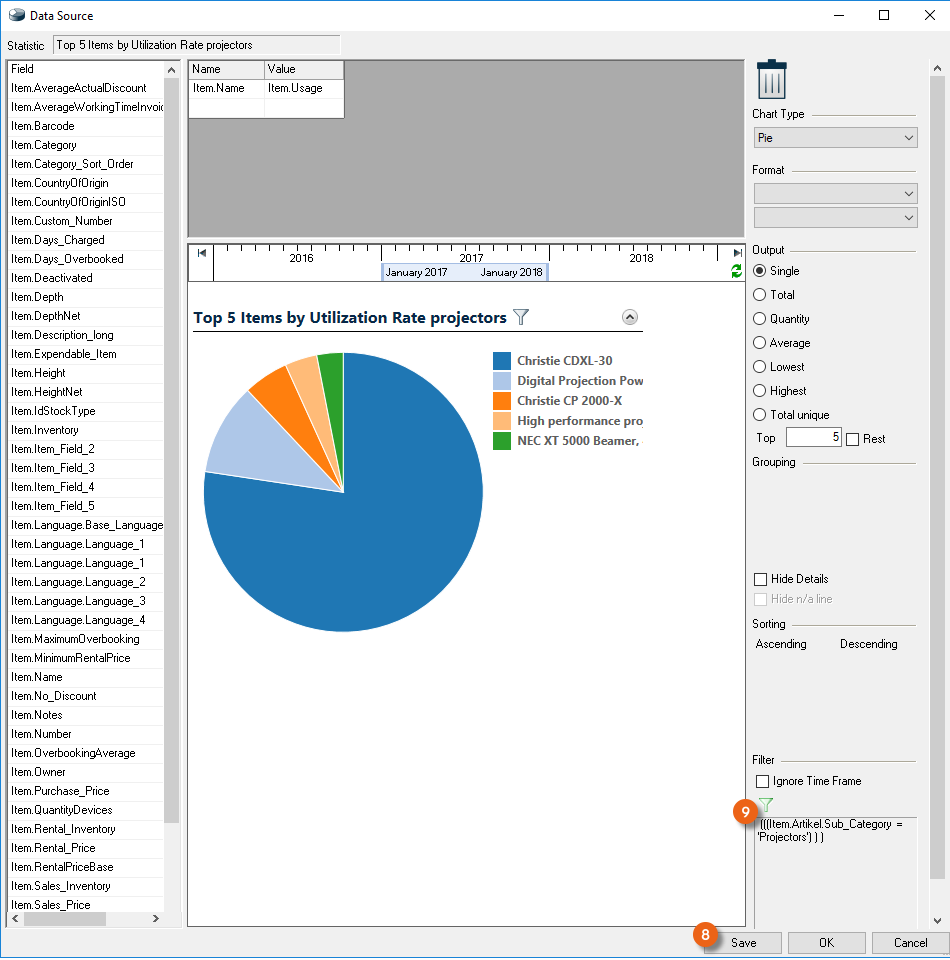
Update the Preview with Save . The content of the active Filter is displayed in the overview.
Sample Statistic, Income from Invoices by Customer
The purpose of the new Statistic is to summarize the marked Line Items in a clearer way and by Customer. Create a new Statistic with the title 'Income from Invoices by Customer' from the Template 'Income from Invoices'.
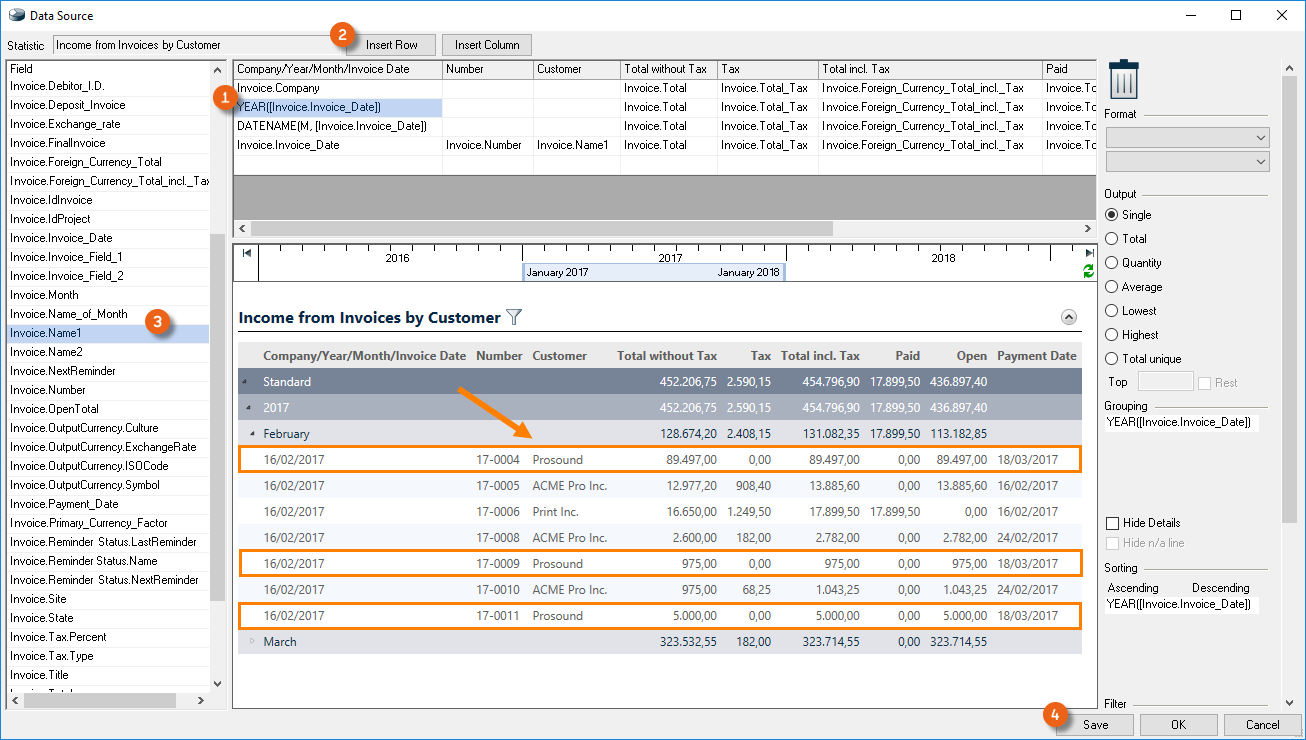
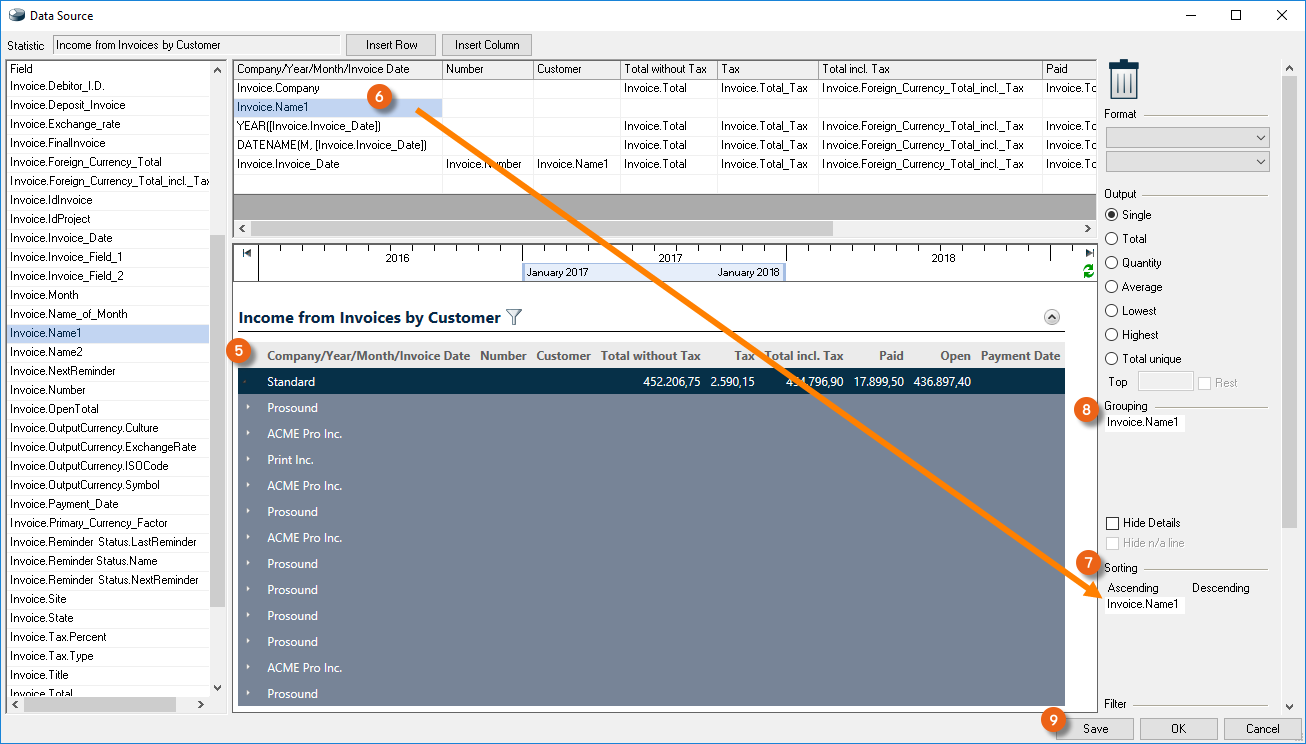
Mark the Line Item from which sorting should start and insert a new Row . Select the Field Invoice.Name1 and Drag&Drop it to the empty row. Save activates your settings. In the Preview you can see that now the Invoice name appears first in the list. To sort it, drag & drop the Field Invoice.Name1 to Sorting . Grouping adjusts automatically. Click Save to update the Preview
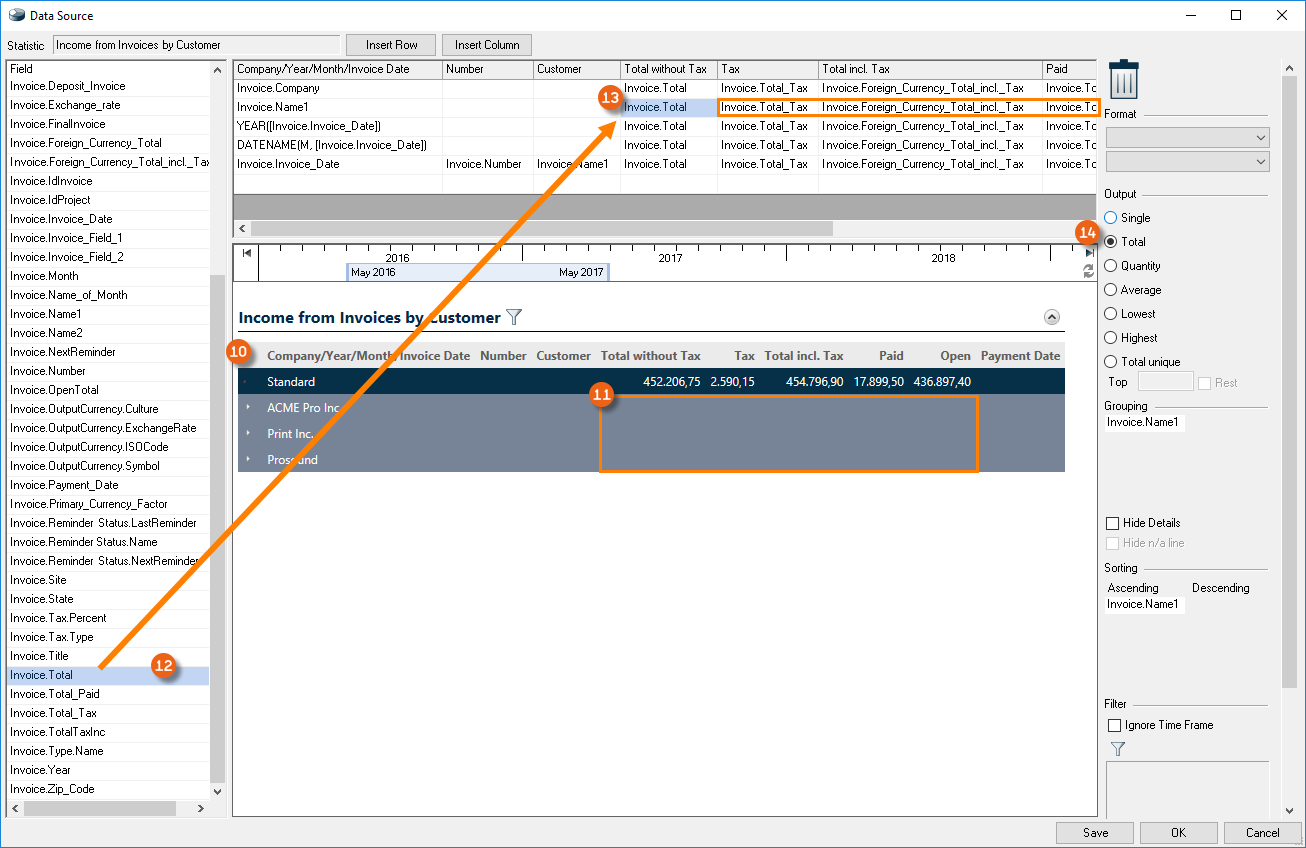
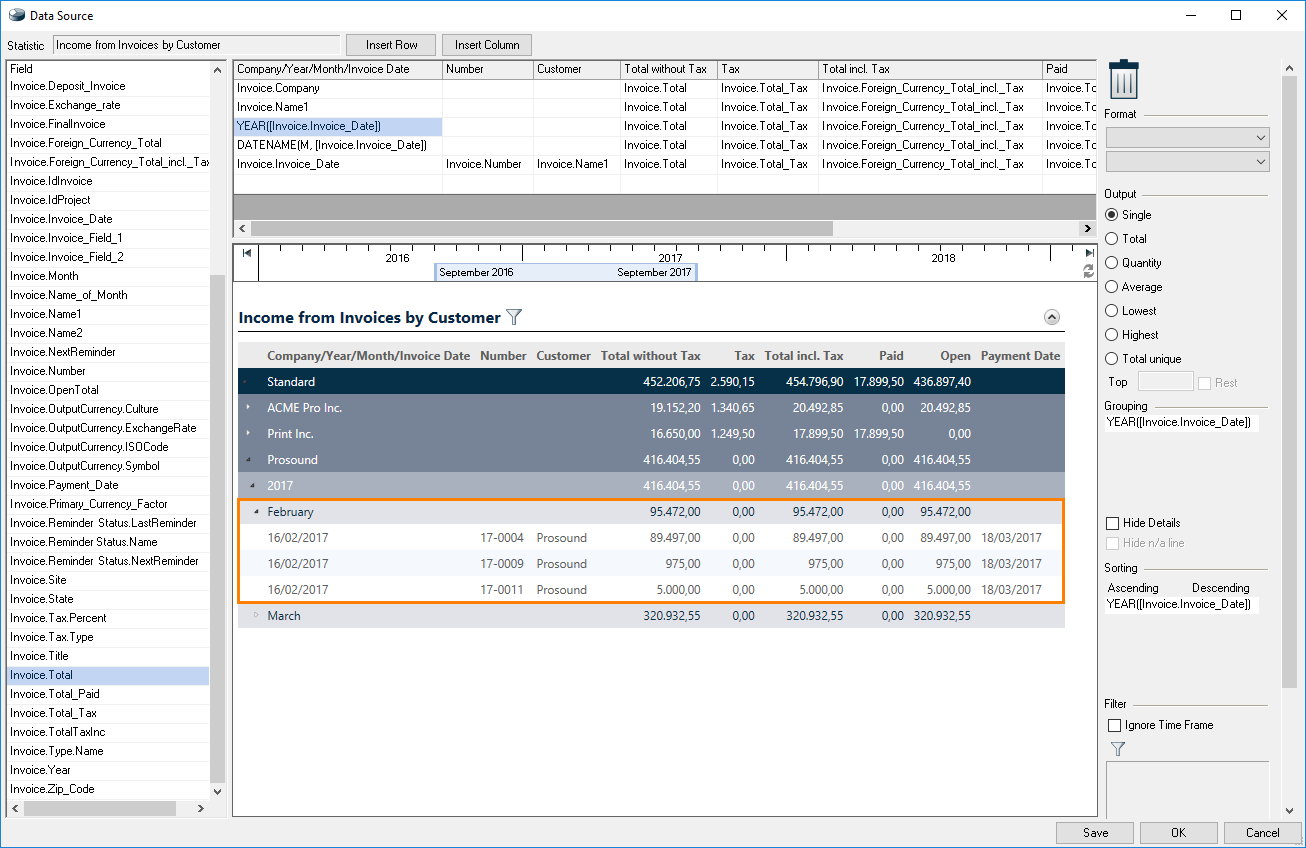
The Result will now be sorted by Customer (ascending) and grouped. To display the totals of the Customer Invoices in the Overview , you must add this to the corresponding field. To do so, select the Field from the Template and Drag & Drop it to the desired cell . Proceed in the same manner for the other cells. The output must be set to Total for all added cells. Click Save to check your result.
Income from Invoices will now be sorted by Customer as required.
Creating your own Statistics
In order to create your own Statistics, first enter a name and define the necessary Data Sources.
Creating a new Statistic:
1. easyjob Menu Statistics Settings
2. Add
3. New
4. Enter a name and a description, if necessary.
5. Ok
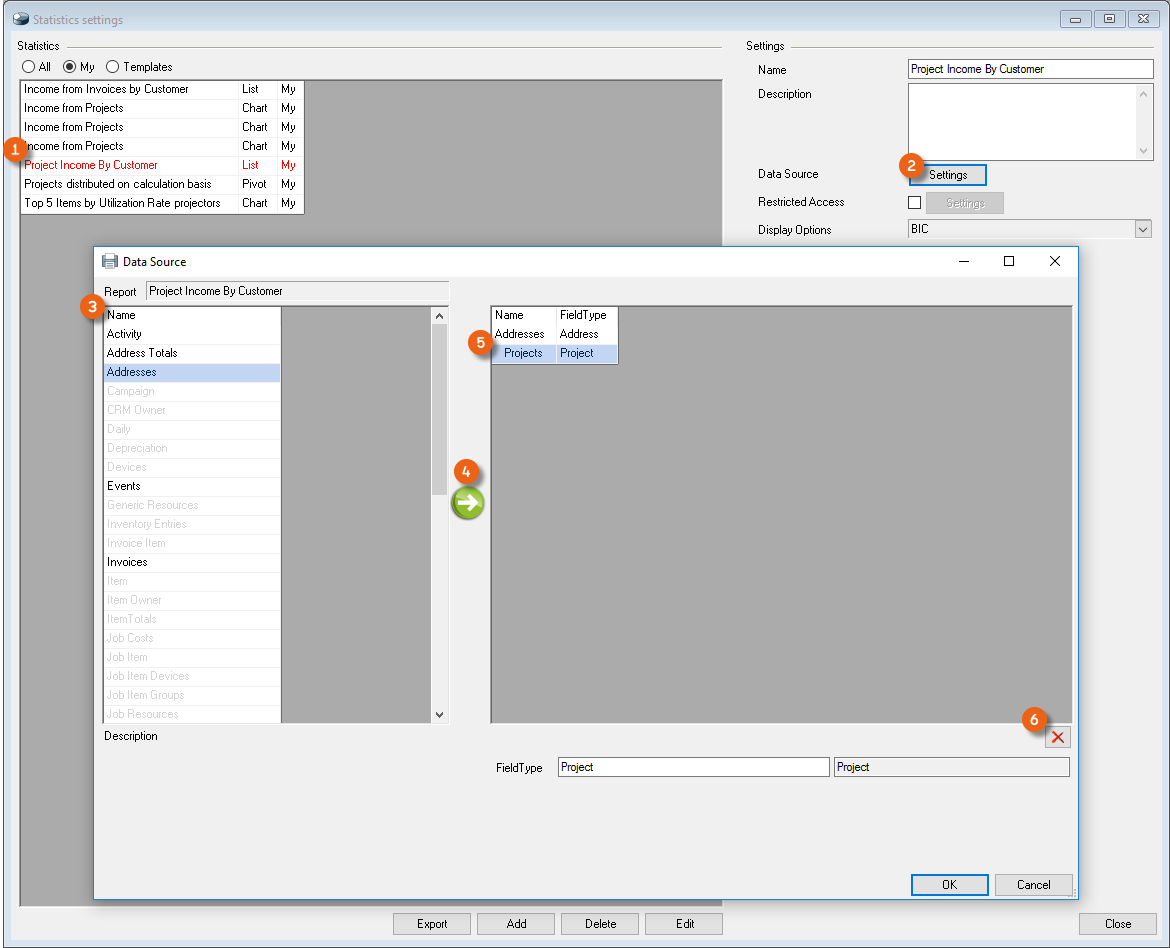
Your new Statistic will be shown in the list. It is displayed in red until filled with content. You can now determine the required settings for the Data Sources . After making the selection transfer your Data Source to the Formula field . If you selected the wrong Data Source, you can remove it . After defining the first Data Source, other Data Sources that suit your selection will be made available. All other names will be highlighted in gray.
Selecting the Data Source and editing the Statistic:
1. easyjob Menu Statistics Settings
2. Select the newly created Statistic
3. Data Source
4. Settings
5. Select the desired Data Source
6. Arrow to move it to the Formula field
7. Continue until all Data Sources are transferred
8. Ok
9. Design
10. Enter the Headings, Variables and, if necessary, the Formulas
11. Save
12. Ok
By selecting the Data Source, you define which Variables are available to you. Currently, the Field Types 'Address' and 'Project' are selected. You can edit the Column headings as required . Drag & Drop the desired Variable to the Formula field . Click Save to update the preview and check your result.
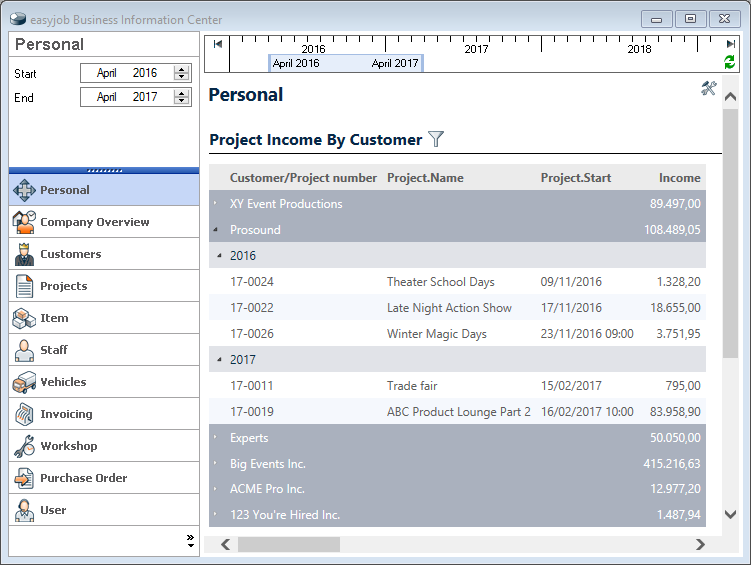
Sample Statistic, Project Income by Customer
Create a new Statistic with the title 'Project Income by Customer' and select the Data Sources 'Address' and 'Project' as described above. Open the Statistic Designer. The possible Variables appear in your field selection. Drag & Drop the desired contents of your cells (rows and columns) to the formula area.
Step by step:
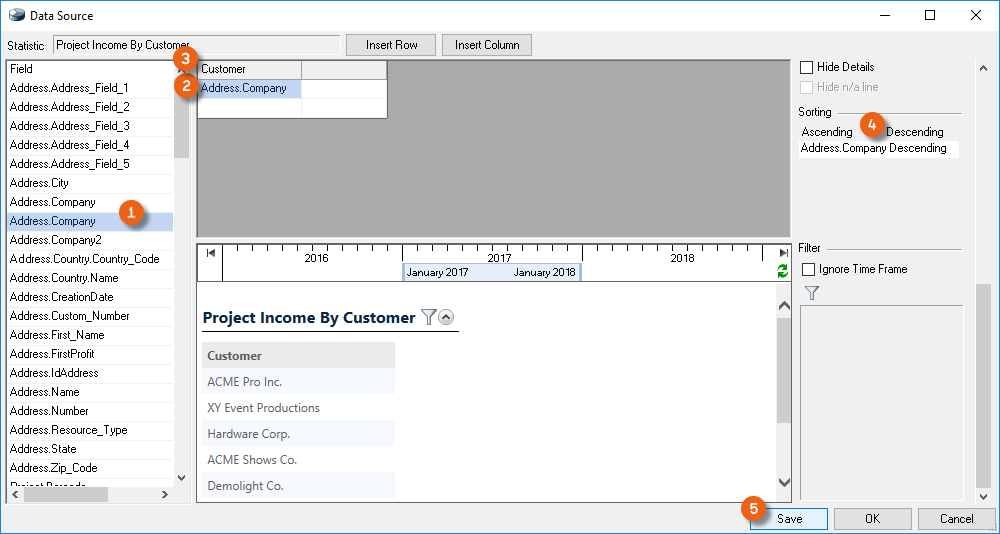
1. Drag & Drop Address.Company to the first Field
2. Assign Customer Name as the column heading
3. Drag & Drop Address.Company to Sorting Descending
4. Save
5. Transfer Project.Number, Project.Name and Project.Start via Drag&Drop
6. Provide the column headings with Customer Name/Project Number, Project Name and Project Start
7. Save
8. The Preview will display the Project Numbers, Project Names and the Project Start Date sorted by customer, without sorting the date
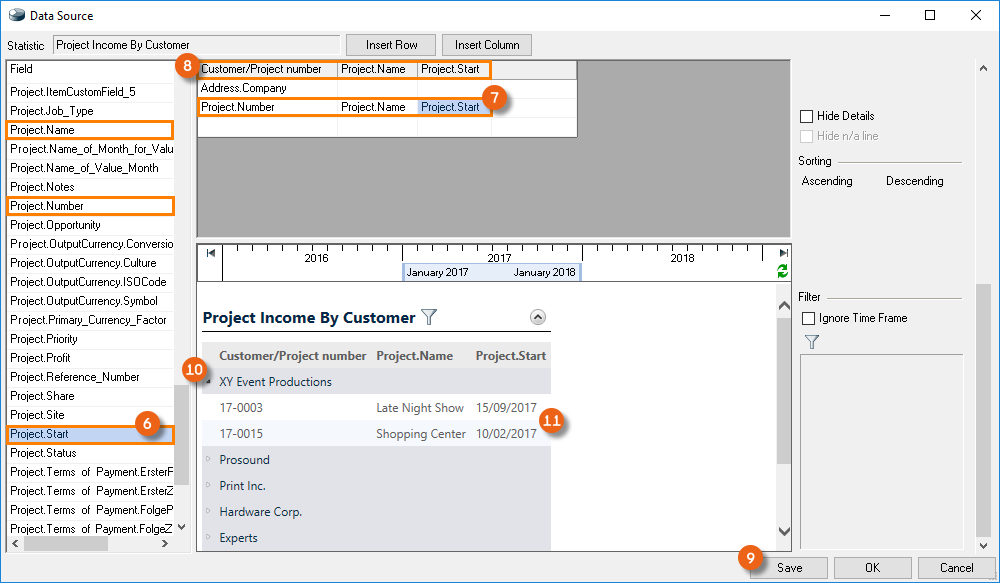
9. Drag & Drop Project.Start to Sorting Ascending
10. Add the Field Project.Income.Total and give the column heading the title Income
11. Save
12. The Preview will show the Projects sorted by Customer and Date and the related Income
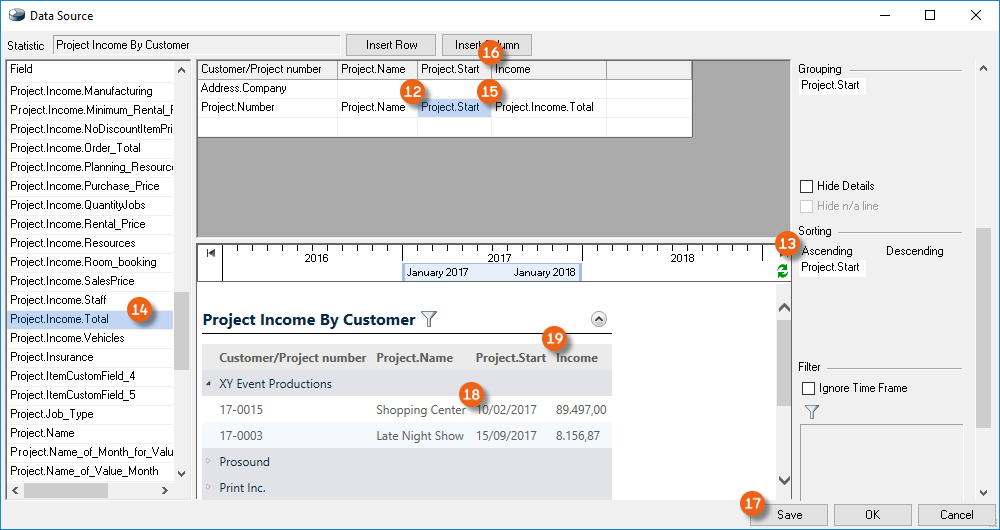
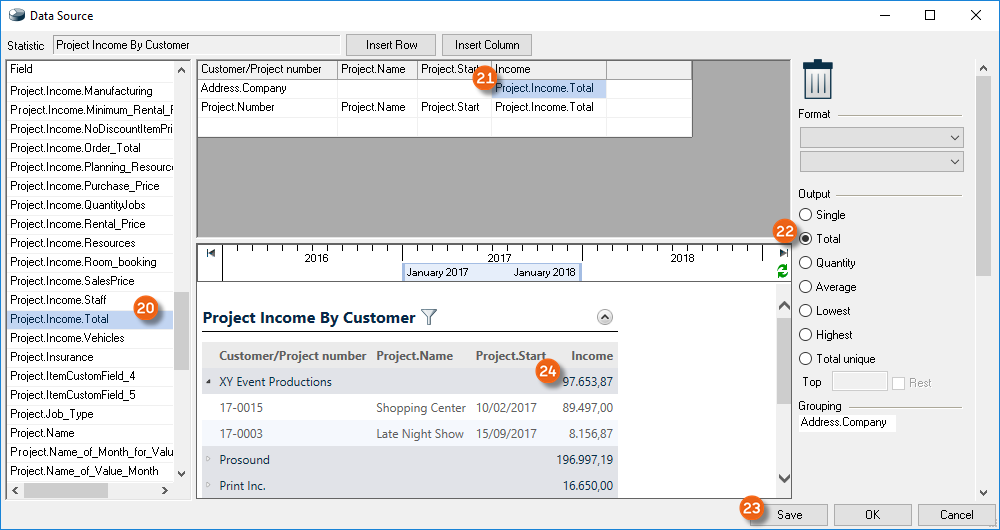
13. Add Project.Income.Total to the row Address.Company in the column Income via Drag&Drop
14. Define the field output as Total
15. Save
16. The Preview will show Total of the individual Income amounts
17. Insert a Row and add Project.ValueDate.Year via Drag&Drop
18. Drag & Drop Project.ValueDate.Year to Sorting Ascending
19. Save
20. The Preview will sort by Year
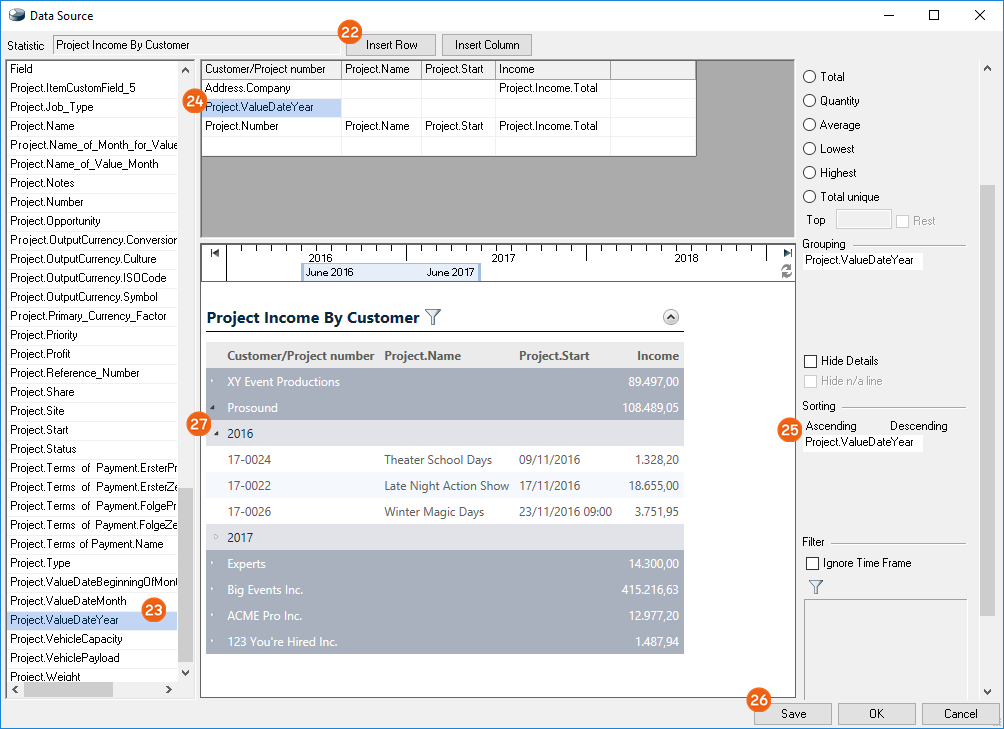
21. Ok
22. Add your newly created Statistic to your personal view area
Statistics variable glossary
In order to create a Statistic, more than one thousand Variables are available to you as a Data Source. Many fields are self-explanatory. We have grouped the Variables that require explanation with the path where they are found in easyjob.
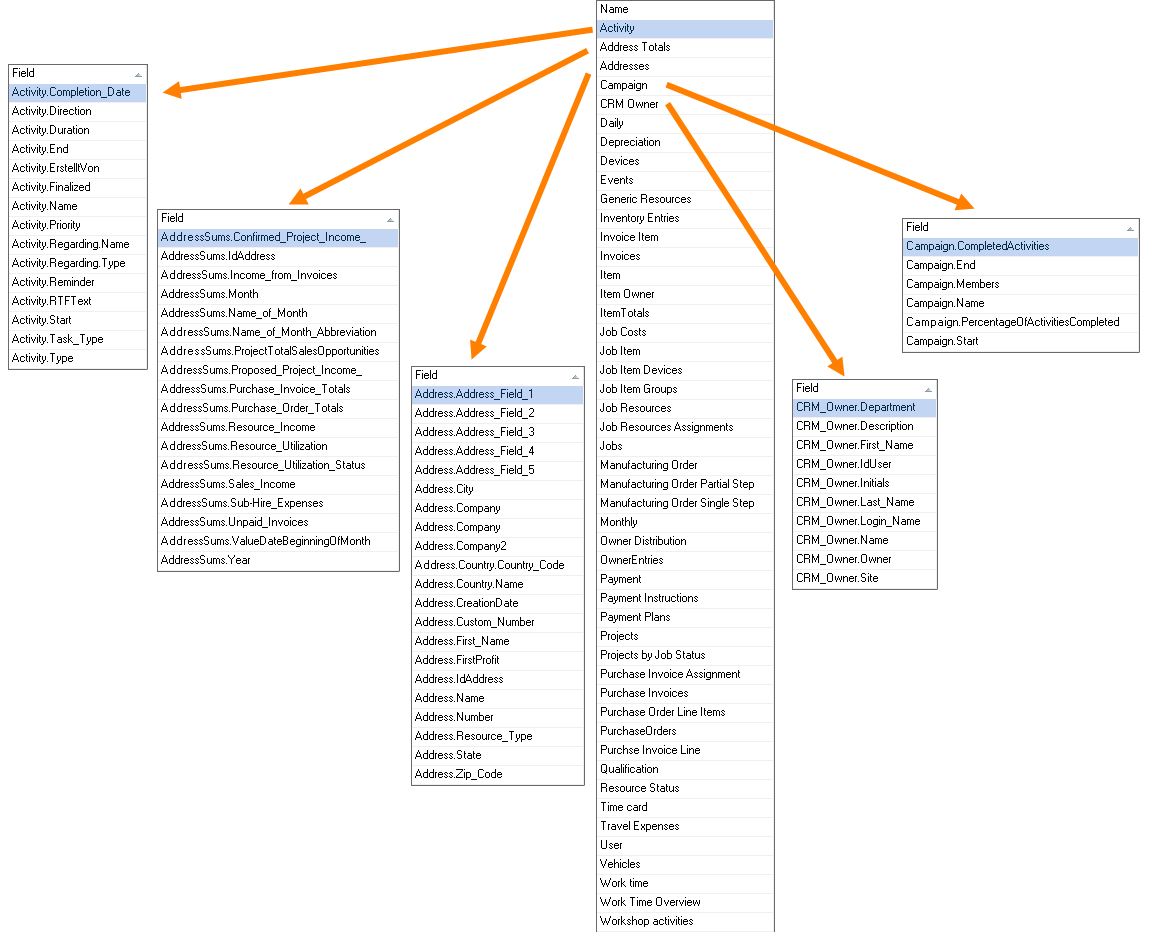
Fields containing 'Id' (e.g. Address.IdAddress) are intended for special SQL queries. Advanced SQL/database knowledge is necessary to use them. Fields that are repeated (e.g. Basis, ValueDate, etc.) are described only once in the following table.
| Field | Description |
|---|---|
| AddressesFields under Master Data Address Edit Address | |
| .FirstProfit | Date when the first profit took place |
| Address sumsThese fields provide a report per month for the queried period | |
| .Month | The month is output as a number (e.g. 6) |
| .Name_of_Month | The month is output as a name (e.g. June) |
| .Name_of_Month_Abbreviation | The month is output as an abbreviation (e.g. Jun) |
| .ValueDateBeginningOfMonth | With Value Date, all months in the queried period are output, also those that do not contain any value and would otherwise be hidden |
| ActivityFields under CRM Activities Edit Activity | |
|---|---|
| Work time overviewFields under Time Card Work Time Overview | |
| Work timeFields under Time Card Calendar Add Work Time | |
| ItemsFields under Master Data Items Edit Item | |
| .DeviceQuantity | All Devices in the inventory |
| .Usage | Usage is calculated via availability. Issued Items / Inventory: (Total(Inventory - (Available + Workshop))) / Total(Inventory) |
| -WeightGross* | Item weight (e.g. a headset case) + gross weight of the Linked Associated Item (if 'Sum Weight' was selected) |
| .WeightBasisGross* | Item weight (e.g. headset case) without the Associated Item |
| .WeightBasisNet* | Article weight (e.g. only the headset) |
| .WeightNet* | Article weight (e.g. only the headset) + net weight of the Linked Associated Items (if 'Sum Weight' was selected) |
| .Sorting | Determined as in the Sub Categories |
| Item OwnerFields under Master Data Item Owner Edit Owner | |
| Item TotalsThese fields provide a report per month for the queried period | |
| .InventoryDeletion | Items that are removed during the month period |
| .ProfitProposed | Profit corresponds to the Total in the Cost Planner |
| .Actual | From post calculation |
| .InventoryEntry | Items that are added during the month period |
*applies also for Width, Height, Depth, Volume
| UserFields under Tools Manage Users Edit User |
|---|
| Purchase Order Line ItemsFields under create/edit Purchase Order Line Item tab |
| Purchase OrdersFields under edit Purchase Order Main Data tab |
| CRM OwnerFields under Master Data Addresses Edit Address CRM tab CRM_Owner* |
| Owner EntriesFields under Master Data Items Edit Item Inventory** |
| Owner DistributionIn the Bill of Items, booked Items will be reported as a percentage in the case of multiple Owners In the case of Devices, a clear assignment can be made to the Owner |
| Purchase Invoice Line ItemsFields under Controlling Edit Purchase Invoice Line Items tab |
| Purchase Invoice assignmentsFields under Controlling Edit Purchase Invoice Line Items tab Assignments tab |
| Purchase InvoicesFields under Controlling Edit Purchase Invoice Main Data tab |
| EventsFields under Master Data Events Edit Events |
| VehiclesFields under Master Data Vehicles Edit Vehicles |
| Manufacturing OrderFields under Manufacturing Controller Edit Manufacturing Process Main Data |
| Manufacturing Order Partial StepFields under Manufacturing Controller Edit Manufacturing Process Partial Step |
| Generic ResourcesFields under Master Data Generic Resources Edit |
* Details in the Address Master Data of the selected CRM Owner
** Check the Owner
| DevicesFields under Master Data Items Edit Item Devices tab |
|---|
| Inventory EntriesFields under Master Data Items Edit Item Inventory tab |
| Job ItemFields under Projects Edit Project Select Project Ok Items Job Bill of Items* |
| Job Item DevicesFields under Projects Edit Project Select Project Ok Items Job Bill of Items** |
Job Item GroupsFields under Projects Edit Project Select Project Ok Items Job Bill of Items Edit Groups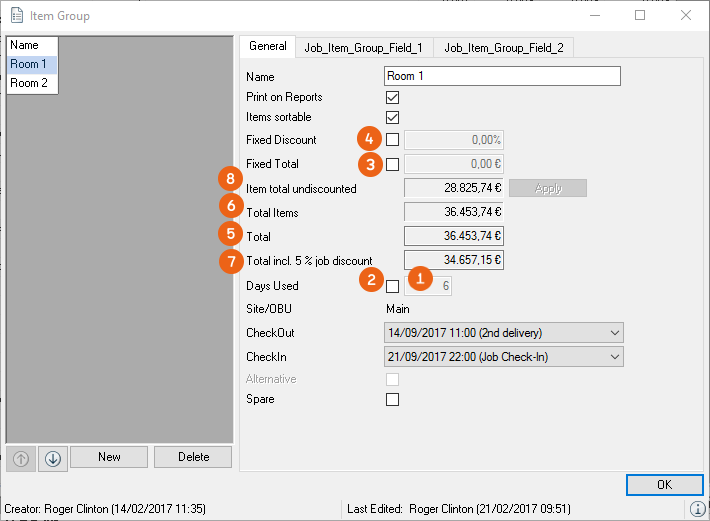 |
| .Days Used |
| .Fixed_Days Used |
| .Fixed_Total |
| .Fixed_Discount |
| .Total |
| .Total Items |
| .Total incl. Job Discount |
| .Itemtotal undiscounted |
* Scheduling mode
**Loading/unloading mode
| Job CostsFields under View Jobs Edit Jobs Select Job Edit Job Costs tab | |
|---|---|
| .Alternative | Alternative Item Group |
| Job Cost TypeFields under Master Data Job Cost Type Edit Job Cost Type | |
| Job ResourcesFields under View Jobs Edit Jobs Select Job Edit Resources tab or Planning Resources tab | |
| .Alternative | Alternative Item Group |
| Job Resources AssignmentsFields under View Jobs Edit Jobs Select Job Edit Resources tab Assign | |
| JobsFields under View Jobs Edit Jobs Select Job Edit | |
| .ActualSub-Rental | Evaluates if it is a Sub-Rental, yes or no |
| .Sorting | Order of the Jobs in the Project |
| CampaignFields under CRM Edit Campaign Select Campaign Ok Main Data/Participant/Activities tab | |
| Monthly | |
| .ValueDate… | With Value Date, all months in the queried period are output, also those that do not contain any value and would otherwise be hidden |
ProjectFields under Projects Edit Project Select Project Ok Cost Planner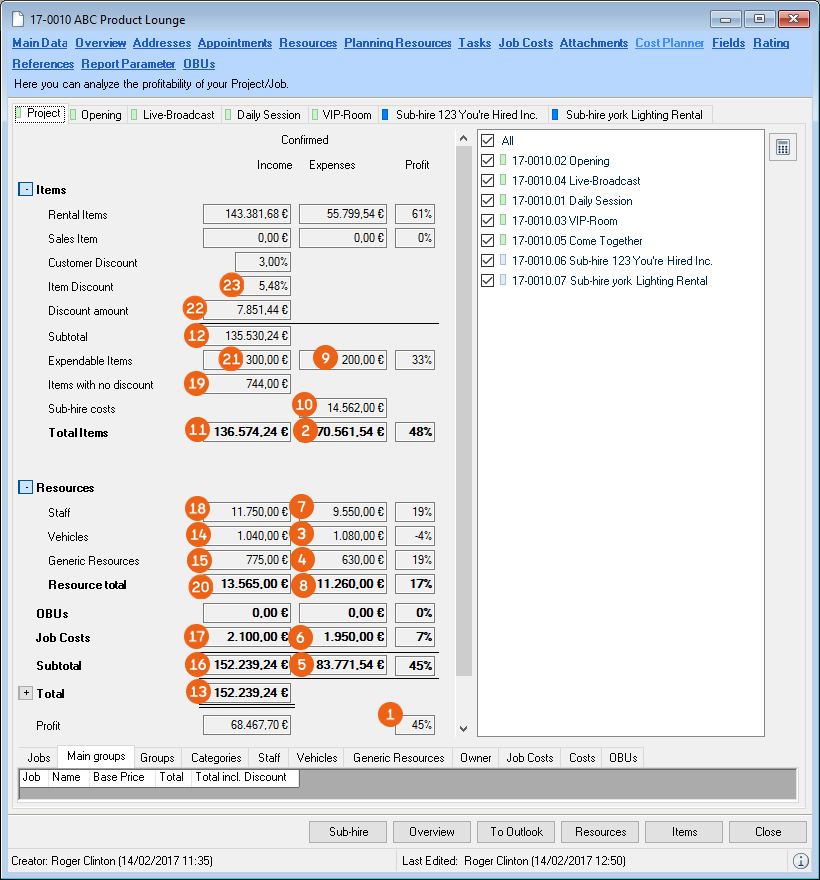 Detailed calculation formulas can be found in the easyjob User Manual Detailed calculation formulas can be found in the easyjob User Manual | |
|---|---|
| .Expenses.Work Time | Total of all Staff costs (incl. Scheduler) |
| .Percentage | .Income.Total |
| .Expenses.Items | .Income.Vehicles |
| .Expenses.Vehicles | .Income.GenericResources |
| .Expenses.GenericResources | .Income.Subtotal |
| .Expenses.Subtotal | .Income.JobCosts |
| .Expenses.JobCosts | .Income.Staff |
| .Expenses.Staff | .Income.Items with no discount |
| .Expenses.Resources | .Income.Resources |
| .Expenses.Expendable Items | .Income.Expendable Items |
| .Expenses.Sub-Rental | .Income.Discount amount |
| .Income.Items | .Income.Item Discount percentage |
| Income.Item inc. discount |
| Projects according to Job StatusContains all variables that can be reported according to Job Status: Proposed, Confirmed or Canceled | |
|---|---|
| QualificationFields under Time Card Calendar Qualification tab Add | |
| InvoicesFields under Invoicing Edit Invoice | |
| Invoice ItemsFields under Invoicing Edit Invoice Select Invoice Edit Invoice Items tab | |
| Resource StatusFields under Master Data Addresses Edit Address Resource tab Add Resource Status | |
| ExpensesFields under Time Card Calendar Expenses tab Add Select Project Ok | |
| Daily | |
| .ValueDate.Date | With the Value Date, all days in the queried period will be output, also those that do not contain a value and would otherwise be hidden. |
| Workshop ActivitiesFields under Workshop Create Activity | |
| Payment instructionsFields under Controlling Payment Instructions | |
| Payment receiptsFields under Invoicing Payment Receipt | |
| Payment plansFields under Project Edit Project Ok Payment Plan tab | |
| Time cardFields under Master Data Addresses Edit Address Time Card tab |
List of a selection of T-SQL commands
In the fields, in addition to using the queries provided in easyjob, you can also use T-SQL formulas
Example: CASE WHEN [WorkshopActivity.Days]>30 THEN 1 ELSE 0 END
In addition to simple formulas, also complex T-SQL queries, such as subselects from other tables, etc., are possible. For these, advanced SQL/database knowledge is required.
You can find a complete reference at https://docs.microsoft.com/en-us/sql/t-sql/language-reference.
We have grouped a selection of T-SQL commands for you in the following table:
| Command | Description | Reference |
|---|---|---|
| CAST | Converts a data type, e.g. in order to convert text information 'Year' into a number value | Open |
| YEAR | Outputs only the year from a date | Open |
| MONTH | Outputs only the month from a date | Open |
| ISNULL | Decision of which value should be used, if the database cell has no content | Open |
| DATENAME | The month of the name is written out from the date | Open |
| CASE WHEN | Query to influence the results depending on the value | Open |
| SUM | Sums all values in a query | Open |
Variable, Formula and Filter Statistics
You can find details about the Statistics provided by us below
Personal
| Name | Income from my invoiced Projects |
|---|---|
| Description | List of Income from all confirmed Projects per Month/Year |
| Data SourcesName (Field Type) | Monthly (date)Projects (Project) |
| Filter |  |
| ( Projects.Project.IdProjectState = 1) | |
| Calculation | 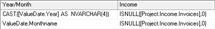 |
| Name | My open Activities |
|---|---|
| Description | Incomplete Activities |
| Data SourcesName (Field Type) | Activity (Activity)User (User) |
| Filter |  |
| ( Activity.Activity.Finalized = 0) | |
| Calculation | 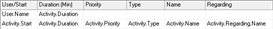 |
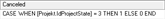
| Name | Project Status Overview |
|---|---|
| Description | Number of Projects by Manager and Status |
| Data SourcesName (Field Type) | Projects (Project)User (User) |
| Filter |  |
| - | |
| Calculation | |
  |
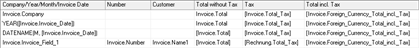
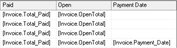
| Name | Income from my Invoices |
|---|---|
| Description | |
| Data SourcesName (Field Type) | Invoices (Invoice) |
| Filter |  |
| - | |
| Calculation | |
  |
Company Overview
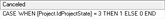
| Name | Confirmed Projects by Month |
|---|---|
| Description | Quantity of Confirmed Projects by Month in Line Diagram format |
| Data SourcesName (Field Type) | Monthly (date)Projects (Project) |
| Filter |  |
| ( Projects.Project.IdProjectState = 1) | |
| Calculation | 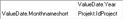 |
| Name | Factored Sales by Month and Year |
|---|---|
| Description | Income from Invoices by Month and Year |
| Data SourcesName (Field Type) | Invoices (Invoice) |
| Filter |  |
| - | |
| Calculation | 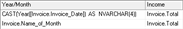 |
Customers
| Name | Top 10 Clients by Total Sales |
|---|---|
| Description | Pie Chart: Top 10 Clients by Total Sales from Projects |
| Data SourcesName (Field Type) | Addresses (Address)Projects (Project) |
| Filter |  |
| ( Projects.Project.IdProjectState = 1) | |
| Calculation | 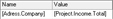 |
| Name | Top 20 Clients |
|---|---|
| Description | |
| Data SourcesName (Field Type) | Addresses (Address)Address Sums (Address Sums) |
| Filter |  |
| ( AddressSums.AddressSums.Confirmed_Project_Income > 0) | |
| Calculation | 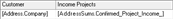 |
| Name | Top 20 Clients by Invoiced Sales |
|---|---|
| Description | |
| Data SourcesName (Field Type) | Addresses (Address)Address Sums (Address Sums) |
| Filter | |
| ( AddressSums.AddressSums.Income_from_Invoices > 0) | |
| Calculation | 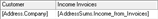 |
| Name | Projected Client Income |
|---|---|
| Description | Projected Income from Confirmed and Proposed Projects in the future |
| Data SourcesName (Field Type) | Addresses (Address)Address Sums (Address Sums) |
| Filter |  |
| ( AddressSums.AddressSums.Confirmed_Project_Income > 0) or ( AddressSums.AddressSums.Proposed_Project_Income > 0) | |
| Calculation | |
  |
Projects
| Name | Top 20 Clients by Total Sales |
|---|---|
| Description | |
| Data SourcesName (Field Type) | Projects (Project) |
| Filter |  |
| ( Projects.Project.IdProjectState = 1) | |
| Calculation | 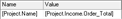 |
| Name | Projects distributed by Type |
|---|---|
| Description | |
| Data SourcesName (Field Type) | Projects (Project) |
| Filter |  |
| ( Projects.Project.IdProjectState = 1) | |
| Calculation | 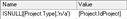 |
| Name | Sales Performance |
|---|---|
| Description | Pivot Table for Income from Confirmed Projects by Month/ Year |
| Data SourcesName (Field Type) | Monthly (date)Projects (Project) |
| Filter |  |
| ( Projects.Project.IdProjectState = 1) | |
| Calculation |  |
| Name | Projects Sales Performance compared |
|---|---|
| Description | Pivot Table for Income from Confirmed Projects by Month/Year |
| Data SourcesName (Field Type) | Monthly (date)Projects (Project) |
| Filter |  |
| - | |
| Calculation |  |
| Name | Projects distributed by Status |
|---|---|
| Description | |
| Data SourcesName (Field Type) | Monthly (date)Projects (Project) |
| Filter |  |
| - | |
| Calculation |  |
| Name | Projects distributed by Income Type |
|---|---|
| Description | |
| Data SourcesName (Field Type) | Projects (Project) |
| Filter |  |
| ( Projects.Project.IdProjectState = 1) | |
| Calculation | |
  |
| Name | Top 20 Projects based on Sales |
|---|---|
| Description | |
| Data SourcesName (Field Type) | Projects (Project) |
| Filter |  |
| ( Projects.Project.IdProjectState = 1) | |
| Calculation |  |
| Name | Top 20 Most Profitable Projects |
|---|---|
| Description | Top 20 Projects by Profit Project Value based on Invoices No Invoices or Purchase Invoices |
| Data SourcesName (Field Type) | Projects (Project) |
| Filter |  |
| ( Projects.Project.IdProjectState = 1) | |
| Calculation | |
  |
Items
| Name | Top 10 Most Profitable Items |
|---|---|
| Description | Chart of the Top 10 Most Profitable Items |
| Data SourcesName (Field Type) | Item (Item)ItemSums (ItemSums) |
| Filter |  |
| - | |
| Calculation |  |
| Name | Top 10 Subrented Items |
|---|---|
| Description | Top 10 Items with the highest Subrental Rate in List format |
| Data SourcesName (Field Type) | Item (Item)ItemSums (ItemSums) |
| Filter |  |
| - | |
| Calculation |  |
| Name | Top 10 Items by Utilization Rate |
|---|---|
| Description | Top 10 Items by Utilization Rate in Pie Chart format |
| Data SourcesName (Field Type) | Item (Item) |
| Filter |  |
| - | |
| Calculation |  |
| Name | Top 10 most Overbooked Items |
|---|---|
| Description | |
| Data SourcesName (Field Type) | Item (Item)ItemSums (ItemSums) |
| Filter |  |
| - | |
| Calculation | 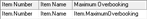 |
| Name | Ratio In-House/Outside Items |
|---|---|
| Description | Chart representing the ratio between own items and foreign items during the selected period based on confirmed jobs |
| Data SourcesName (Field Type) | Jobs (Job)Job Item (JobItem) |
| Filter |  |
| ( Jobs.Job.IdJobState = 1) | |
| Calculation | 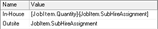 |
Staff
| Name | Top 10 Team Members by Resource Type |
|---|---|
| Description | Top 10 Resource Types by Income in Pie Chart format |
| Data SourcesName (Field Type) | Job Resources (JobResource)Jobs (Job) |
| Filter |  |
| ( Job Resources.JobResource.Type = Staff) and ( Jobs.Job.IdJobState = 1) | |
| Calculation | 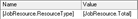 |
| Name | Income from Employees |
|---|---|
| Description | |
| Data SourcesName (Field Type) | Job Resources (JobResource)Jobs (Job) |
| Filter |  |
| ( Projects.Project.IdProjectState = 1) | |
| Calculation |  |
Vehicles
| Name | Top 10 Vehicles by Resource Type |
|---|---|
| Description | Top 10 Resource Types by Income in Pie Chart format |
| Data SourcesName (Field Type) | Job Resources (JobResource)Jobs (Job) |
| Filter |  |
| ( Job Resources.JobResource.Type = Vehicle) and ( Jobs.Job.IdJobState = 1) | |
| Calculation |  |
| Name | Income from Vehicles |
|---|---|
| Description | Income from all Vehicles per month |
| Data SourcesName (Field Type) | Monthly (date)Job Resources (JobResource)Jobs (Job) |
| Filter |  |
| ( Job Resources.JobResource.Type = Vehicle) and ( Jobs.Job.IdJobState = 1) | |
| Calculation | |
 |
Invoicing
| Name | Distribution of Invoices/Credits |
|---|---|
| Description | |
| Data SourcesName (Field Type) | Invoices (Invoice) |
| Filter |  |
| Calculation | 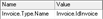 |
| Name | Number of Invoices/Credits |
|---|---|
| Description | List of Invoices for the selected time frame |
| Data SourcesName (Field Type) | Monthly (date)Invoices (Invoice) |
| Filter |  |
| - | |
| Calculation | 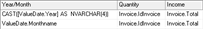 |
| Name | Factored Sales by Month and Year |
|---|---|
| Description | Income from Invoices by Month and Year |
| Data SourcesName (Field Type) | Invoices (Invoice) |
| Filter |  |
| - | |
| Calculation |  |
Workshop
| Name | Workshop Activity Distribution by Cause |
|---|---|
| Description | Causes of Defect in Pie Chart format |
| Data SourcesName (Field Type) | Workshop Activities (workshop activity) |
| Filter | 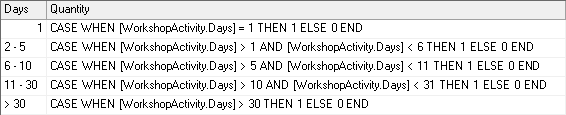 |
| - | |
| Calculation | 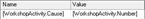 |
| Name | Workshop Size Classification |
|---|---|
| Description | Workshop Activities by Duration |
| Data SourcesName (Field Type) | Workshop Activities (workshop activity) |
| Filter |  |
| - | |
| Calculation | 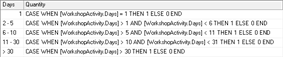 |
Purchase Order System
| Name | Purchase Orders |
|---|---|
| Description | Purchase Orders by Time frame |
| Data SourcesName (Field Type) | Purchase Orders (Purchase Order)Addresses (Address) |
| Filter |  |
| - | |
| Calculation | 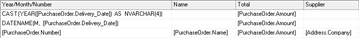 |
| Name | Purchase Orders by Supplier |
|---|---|
| Description | Purchase Orders by Time frame |
| Data SourcesName (Field Type) | Purchase Orders (Purchase Order)Addresses (Address) |
| Filter |  |
| - | |
| Calculation | |
 |
User
| Name | Projects created by User |
|---|---|
| Description | Projects created by User in selected Time frame in Pie Chart format |
| Data SourcesName (Field Type) | Projects (Project)User (User) |
| Filter |  |
| ( Projects.Project.DateCreated >= Constants.StartDate) and ( Projects.Project.DateCreated < Constants.EndDate) | |
| Calculation |  |
| Name | Confirmed Projects by User |
|---|---|
| Description | Confirmed Projects by User in Pie Chart format |
| Data SourcesName (Field Type) | Projects (Project)User (User) |
| Filter |  |
| ( Projects.Project.IdProjectState = 1) | |
| Calculation |  |
| Name | Project Status Overview by User |
|---|---|
| Description | Number of Projects by Manager and Status |
| Data SourcesName (Field Type) | Projects (Project)User (User) |
| Filter |  |
| - | |
| Calculation | |
  |
| Name | Project Income by User |
|---|---|
| Description | Profit by Project Manager |
| Data SourcesName (Field Type) | Projects (Project)User (User) |
| Filter |  |
| ( Projects.Project.IdProjectState = 1) | |
| Calculation | |
   |